Solana is one of the fastest blockchains in production, but the headline numbers you see on Twitter rarely tell the full story. "65,000 TPS" does not mean what most people think it means. Validator counts without context about stake distribution are meaningless. And uptime statistics are more nuanced than "100% or not."
This guide breaks down every major Solana network metric — what it measures, how to interpret it correctly, and where to find reliable data. Whether you are evaluating Solana as an investor, a developer choosing where to build, or a validator assessing the network, this is the reference you need.
Transactions Per Second (TPS)
TPS is the most cited and most misunderstood Solana metric.
Theoretical vs. Actual TPS
Theoretical maximum: Solana's architecture was designed to handle up to 65,000 TPS. This number comes from the theoretical throughput of the Turbine block propagation protocol combined with Sealevel parallel transaction execution.
Actual TPS: In practice, Solana processes between 2,000 and 5,000 transactions per second during normal network operation. During peak demand (major mints, memecoin launches, market crashes), this can spike higher.
Why the gap exists:
- The theoretical max assumes all transactions are perfectly parallelizable. Real transactions often touch the same accounts, forcing sequential processing.
- Network consensus overhead consumes bandwidth.
- Validators have varying hardware capabilities, and the network runs at the speed of the majority, not the fastest nodes.
- Transaction scheduling and prioritization add latency.
Vote Transactions vs. User Transactions
This is the single most important distinction when evaluating Solana TPS.
Vote transactions are internal consensus messages where validators vote on the validity of blocks. They make up a significant portion of total Solana transactions — often 60-80% during normal periods.
Non-vote transactions are actual user activity: token swaps, NFT trades, transfers, DeFi interactions. This is the metric that reflects real demand for Solana blockspace.
When someone claims "Solana is doing 4,000 TPS," ask whether that includes vote transactions. The actual user TPS is typically 800-2,000 during normal operation, which is still faster than virtually every other L1 blockchain, but it is important to compare apples to apples.
Where to Track TPS
| Tool | What It Shows | Best For |
|---|
| Solana Explorer | Real-time TPS with vote/non-vote split | Quick current snapshot |
| Solanabeach | Historical TPS trends, cluster stats | Trend analysis |
| Chainspect | Cross-chain TPS comparison | Comparing Solana to other L1s |
Validators
Validators are the backbone of Solana's proof-of-stake consensus. They produce blocks, vote on consensus, and secure the network. Understanding validator metrics tells you about Solana's security and decentralization.
Validator Count
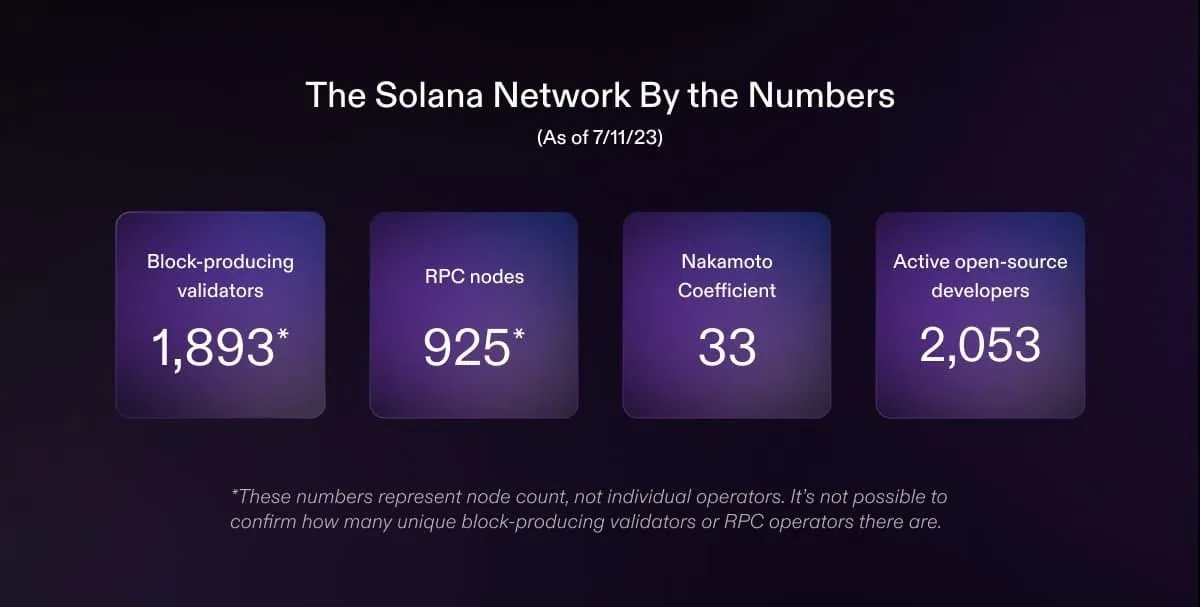
As of early 2026, Solana has approximately 1,400-1,600 active validators on mainnet-beta, with several thousand additional RPC nodes that do not participate in consensus.
How to interpret validator count:
- More validators = more decentralization — A higher validator count makes it harder for any coalition to censor transactions or halt the network.
- Quality over quantity — 100 validators each running on dedicated hardware in unique data centers is more resilient than 1,000 validators running on the same three cloud providers.
- Active vs. delinquent — Not all validators are performing well. Delinquent validators are not participating in consensus and should be excluded from count metrics.
The Nakamoto Coefficient
The Nakamoto coefficient measures the minimum number of validators that would need to collude to compromise the network (halt it or censor transactions). For Solana, this requires controlling 33.3% of the total stake.
Current state: Solana's Nakamoto coefficient has steadily improved and sits around 30-35 validators as of 2026. This means approximately 30-35 of the largest validators would need to collude to halt the network.
For context:
- Bitcoin's Nakamoto coefficient (mining pools): ~4-5
- Ethereum's Nakamoto coefficient (staking): ~5-8
- Solana's Nakamoto coefficient: ~30-35
Solana actually performs well on this metric relative to other major chains, though the comparison is imperfect because the security models differ fundamentally.
Stake Distribution
Stake distribution shows how SOL is allocated across validators. A healthy distribution means stake is spread across many validators rather than concentrated in a few.
Key metrics to watch:
- Superminority — The smallest set of validators controlling 33.3%+ of stake. Fewer validators in the superminority = more stake concentration (worse for decentralization).
- Top 10 validator stake share — What percentage of total stake do the 10 largest validators hold? Lower is better.
- Long tail — How many validators have meaningful stake (enough to produce blocks regularly)? A long tail of validators with trivial stake does not meaningfully contribute to security.
Where to track: StakeWiz provides the most detailed stake distribution analysis for Solana, including historical trends, concentration metrics, and individual validator performance.
Validator Performance Metrics
When choosing a validator to stake with or assessing network health, these metrics matter:
Skip rate: The percentage of assigned leader slots where a validator fails to produce a block. A skip rate under 5% is good. Above 10% suggests performance issues. Network-wide average skip rate indicates overall network health.
Vote credits: The number of successful votes a validator submits per epoch. Higher vote credits generally mean better performance and more rewards for stakers. Compare against the cluster average.
Commission rate: The percentage of staking rewards the validator keeps. Most Solana validators charge 5-10% commission. Lower is not always better — validators with 0% commission may not be sustainable long-term.
Uptime: What percentage of epochs has the validator been active? Look for 99%+ uptime over extended periods, not just the current epoch.
Data center concentration: Check where the validator runs. If too many validators run in the same data center (e.g., all on Hetzner in Germany), a single data center outage could affect a large portion of stake.
Block Times
Solana targets a block time of 400 milliseconds, which is dramatically faster than Ethereum's 12 seconds or Bitcoin's 10 minutes.
How Block Production Works
Solana uses a leader-based block production model:
- The leader schedule is predetermined for each epoch (roughly 2-3 days). Every validator knows which validator will be the leader for each slot.
- During their assigned slots, the leader collects transactions, creates a block, and distributes it to the network via Turbine.
- Other validators vote on the block's validity.
- After enough votes, the block is confirmed and eventually finalized.
Slot Time vs. Block Time vs. Finality
These are different things and get confused constantly:
- Slot time (~400ms): The target duration of each slot. Not every slot produces a block (some are skipped).
- Block time: The actual time between produced blocks. Because of skipped slots, the effective block time is slightly higher than 400ms.
- Confirmation time (~5 seconds): The time until a transaction reaches "confirmed" status (voted on by a supermajority).
- Finality time (~12-13 seconds): The time until a transaction is finalized (rooted) and cannot be reverted. This is the security-relevant metric.
For practical purposes, most applications treat "confirmed" as sufficient. Finalized transactions provide maximum security but take longer.
Monitoring Block Production
Solana Explorer shows real-time block production including:
- Current slot and block height
- Recent block times
- Skip rates for the current epoch
- Leader schedule for upcoming slots
Network Uptime
Solana's uptime history has been a contentious topic. Understanding it requires context.
Historical Outage Timeline
Solana experienced several significant outages in its early years (2021-2023), ranging from a few hours to over a full day. These were primarily caused by:
- Bot spam overwhelming the network — High-demand events (IDOs, NFT mints) generating more transactions than the network could process
- Consensus bugs — Software bugs in the validator client causing forks or halts
- Resource exhaustion — Validators running out of memory or compute resources
Improvements Since Then
Solana's engineering team has implemented substantial improvements:
- QUIC protocol — Replaced UDP for transaction ingestion, providing stake-weighted quality of service. High-stake validators get priority, and spam is rate-limited.
- Priority fees — Economic mechanism that lets users pay more for guaranteed inclusion, reducing the incentive to spam.
- Local fee markets — Fees are determined per-account, so congestion on one program does not affect unrelated transactions.
- Scheduler improvements — Better transaction scheduling reduces conflicts and increases effective throughput.
- Firedancer — Jump Crypto's independent validator client adds client diversity, reducing the risk of a single-client bug halting the entire network.
How to Assess Current Uptime
- Solana Status (status.solana.com) — Official status page showing current network health
- Chainspect — Tracks uptime across multiple chains for comparison
- Solanabeach — Shows epoch progress and any performance anomalies
Fee Metrics
Solana's fee structure has evolved significantly and is worth understanding in detail.
Base Fees
Every Solana transaction pays a base fee of 5,000 lamports (0.000005 SOL) per signature. This is deterministic and cheap — roughly $0.001 at typical SOL prices.
Priority Fees
Users can attach priority fees to their transactions to increase the probability of inclusion during congested periods. Priority fees are priced in compute units and vary based on demand.
How to interpret priority fee trends:
- Rising average priority fees — Increasing demand for blockspace. Bullish for SOL as fee revenue grows.
- Priority fee spikes — Short-term congestion events, usually around major token launches or market volatility.
- Low priority fees — Network is not congested. Transactions get included easily without extras.
Fee Burn vs. Validator Revenue
50% of all transaction fees on Solana are burned (permanently removed from supply), and 50% go to the block-producing validator. This means increasing fee revenue has a deflationary effect on SOL supply.
Track the burn rate relative to inflation (staking rewards) to assess whether SOL is net inflationary or deflationary during any given period.
Epoch and Staking Metrics
What Is an Epoch?
A Solana epoch is approximately 2-3 days (432,000 slots). Key things happen at epoch boundaries:
- Staking rewards are distributed
- Stake activations and deactivations take effect
- Validator leader schedule for the next epoch is calculated
- Vote credits are tallied
Staking Participation Rate
The percentage of total SOL supply that is staked. As of 2026, roughly 65-70% of SOL is staked. High staking participation means:
- Strong network security — More stake = more expensive to attack
- Reduced liquid supply — Less SOL available for selling, potentially bullish for price
- Higher opportunity cost — DeFi protocols need to offer yields above staking returns to attract capital
Inflation and Real Yield
Solana's inflation rate started at 8% and decreases by 15% per year, approaching a long-term target of 1.5%. The actual yield for stakers is:
Real yield = Staking APY - Inflation Rate
If staking APY is 7% and inflation is 5%, your real yield is approximately 2%. Non-stakers experience the full dilution of inflation, making staking almost mandatory for long-term SOL holders.
How to Monitor Solana Network Performance
Daily Monitoring Toolkit
For quick checks:
For deeper analysis:
- StakeWiz — Validator performance, stake distribution, staking optimization
- Chainspect — Cross-chain comparisons and uptime tracking
For developers:
- Solana CLI tools (
solana cluster-version, solana validators, solana block-production)
- RPC health checks via
getHealth and getPerformanceSamples
Key Metrics Dashboard
If you build a personal monitoring dashboard, include these metrics:
| Metric | Frequency | Source |
|---|
| Non-vote TPS | Real-time | Solana Explorer |
| Active validators | Daily | Solanabeach |
| Nakamoto coefficient | Weekly | StakeWiz |
| Network skip rate | Per epoch | Solana CLI |
| Priority fee average | Daily | Dune Analytics |
| Staking participation | Per epoch | StakeWiz |
| Total fee revenue | Daily | Solana Explorer |
Setting Up Alerts
Configure alerts for anomalous network conditions:
- TPS drops below threshold — Could indicate network issues or degraded performance
- Skip rate spikes — Multiple validators skipping suggests a potential consensus issue
- Validator count drops — Mass validator outages could indicate infrastructure problems
- Fee spikes — Unusual demand for blockspace, could be MEV opportunity or attack
Comparing Solana to Other Networks
When evaluating Solana's metrics, context matters. Here is how key metrics compare:
| Metric | Solana | Ethereum | Bitcoin |
|---|
| Block time | ~400ms | ~12s | ~10min |
| User TPS | 800-2,000 | ~15-30 | ~7 |
| Finality | ~12s | ~13min | ~60min |
| Validators | ~1,500 | ~900,000 | ~15,000 nodes |
| Nakamoto coefficient | ~30-35 | ~5-8 | ~4-5 |
| Base fee | ~$0.001 | ~$0.50-5 | ~$1-20 |
| Staking yield | ~7% | ~3.5% | N/A |
Important caveats:
- Ethereum validator count includes all individual validators (32 ETH each), many of which are controlled by the same entities (Lido, Coinbase, etc.)
- Bitcoin "nodes" and Solana "validators" serve different functions and are not directly comparable
- Fee comparisons fluctuate significantly with network demand and token prices
What the Numbers Mean for You
For Investors
Solana's network metrics paint a picture of a maturing, high-performance blockchain. Key things to watch:
- Non-vote transaction growth — The clearest signal of increasing real demand
- Fee revenue trend — Sustainable fee revenue reduces dependency on inflation
- Developer activity — New programs deployed and active development on existing protocols
- Decentralization improvement — Rising Nakamoto coefficient and broader stake distribution reduce systemic risk
For Developers
Network stats inform architectural decisions:
- Reliable 400ms blocks mean you can build responsive applications
- Low fees enable micro-transaction business models impossible on other chains
- High TPS headroom means your application is unlikely to be bottlenecked by network capacity
- Priority fee markets mean you should implement fee estimation for time-sensitive transactions
For Validators
Performance metrics directly impact your profitability:
- Vote credits determine rewards — Maximize uptime and minimize skip rate
- Stake concentration creates opportunity — Delegators increasingly seek smaller, independent validators
- Commission rates are competitive — Differentiate on performance, geography, and community engagement rather than just low commission
- Hardware requirements continue to increase — Budget for upgrades, especially with Firedancer's requirements
Staying Informed
The Solana network is constantly evolving. Major upcoming changes that will affect these metrics include continued Firedancer rollout, potential changes to the fee model, and governance changes to inflation parameters.
Bookmark Solana Explorer, StakeWiz, and Solanabeach for your regular monitoring. Follow the Solana Foundation's blog and engineering updates for context on metric changes. And always look at the numbers critically — headline stats without context can be misleading in either direction.