Written by the DexTrading team · Walkthrough with live Solana data read on 28 October 2026, 13:13–13:31 UTC · Disclosure: DexTrading's own pages are used as the worked example throughout. Not financial advice.
A smart money tracker answers one question very quickly: which profitable wallets are buying what, right now. It cannot answer the question that actually decides your result, which is whether a particular wallet is worth following at all, and whether the buy you are looking at is still a buy by the time you see it.
This walkthrough is about that second question. It uses four real Solana wallets, read on 28 October 2026, and shows how to judge a track record from the numbers a wallet page gives you, how to tell profit that was actually taken from profit that only exists on paper, and how to check what a wallet did after it bought before you copy the buy. The worked examples come from DexTrading's public pages, so every figure here can be opened and checked against the chain. Each figure carries the UTC time it was read, because on Solana a number from this morning can already be wrong this afternoon.
Key points
- A wallet's headline profit is usually realized profit: money it got back from sales. Coins it still holds can wipe that out. Always look for an "all-in" figure that counts them.
- Six numbers tell you most of what you need: how many coins it traded, how much profit came from one coin, how long it holds, how many coins went to zero, its win rate, and an overall score.
- A buy is only half of a trade. Before you follow one, find the wallet's sales of that coin, their times, and how much it still holds.
- Some wallets are too fast to follow. If a wallet sells within a minute, any copy arrives after the move.
- Start small, follow the exits as well as the entries, and treat everything here as education, not financial advice.
In this walkthrough
- What a Solana smart money tracker shows
- Realized vs unrealized profit, with one wallet's own numbers
- Six track-record checks, applied to four wallets
- One buy followed all the way to its sales
- Checking later sales before you follow a buy
- When a wallet is too fast to follow
- Seeing where smart money moves early: narratives and the AI Trader
- From watching to copying: the last step
- A checklist to save, common mistakes and risks
- FAQ
What does a Solana smart money tracker actually show you?
"Smart money" is a loose phrase. On a blockchain it usually means wallets whose past trades made money, ranked by some rule. The rule matters more than the label, so read it before you trust a list.
On DexTrading's Solana smart money tracker, the rule is printed under the map. At 13:27 UTC on 28 October it said the page was "based on 8,184 wallets analyzed on this chain, 3,966 of them proven (profitable over 30 days, 40%+ win rate, no bots)". Token bubbles cover the last 24 hours; the profit shown for each wallet is realized over 7 days. The public view runs 10 minutes behind the chain, which is worth remembering whenever a coin moves fast.
A tracker of this kind gives you three things:
- Who is buying what. The map joins each proven wallet to the tokens it bought, so wallets that sit between several tokens are buying them together.
- Summary tiles. The most-bought token, a new crowd forming, tokens smart money is leaving, and the "hottest wallet" by recent profit.
- A path to each wallet's record. Every dot opens a wallet page with its trades, its open positions and a score.

The summary row of the Solana smart money tracker, 28 Oct 2026, 13:27 UTC. The "hottest wallet" tile shows realized profit over 7 days. Section 2 follows that wallet's open positions.
The hottest-wallet tile is a good place to start learning, because it shows the trap in its plainest form. At 13:27 UTC it named 13fK...bYPM with "+$66.56K in 7 days · 93% win rate". Both numbers are true. Neither tells you whether copying that wallet would have made you money.
Realized vs unrealized profit: what is the difference, and why does it change the verdict?
Every trade has two halves. When a wallet sells some of a coin, the gap between what it got back and what that part cost is realized profit or loss: it has happened, and it cannot change. Whatever the wallet still holds has an unrealized result: today's value of those coins minus what they cost. That number moves with the price, and on small Solana tokens it can move to almost nothing.
Three numbers to keep apart
- Realized = money from sales − the cost of the coins that were sold.
- Unrealized = today's value of the coins still held − the cost of those coins.
- All-in = realized + unrealized. This is the figure that answers "did this wallet make money?"
Most wallet pages lead with realized profit, because it is exact and easy to compute from swaps. DexTrading's wallet pages say so in plain words: "Realized profit counts completed swaps only; whatever the wallet still holds is marked at the current DEX price." The all-in view sits elsewhere: in a wallet's open positions, in the report card's "all-in" figure, and in the "All-in" column of the copy page's trader table.
The wallet that took $66,561 and was still down $71,197
The hottest wallet that afternoon was 13fKkRz2Fa4BV3kkgTSD9PKDMdsQaRjsZRjYTnApbYPM (wallet page). Its page at 13:27 UTC read "Profitable scalper · In profit": $152.38K made in 30 days on 173 tokens, a 76% win rate, about 9 minutes average hold, 1,005 trades, a trader score of 74 (grade B), and "Top 1%" for profit among 39,338 Solana wallets.
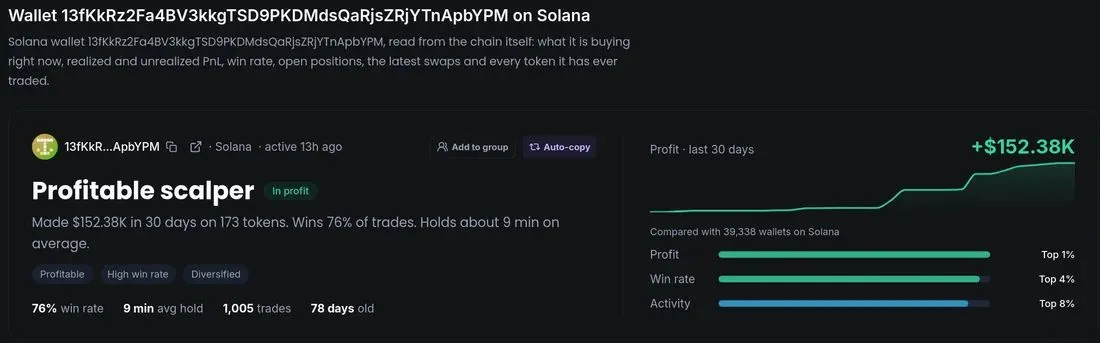
The top of wallet 13fKk...bYPM's page, 28 Oct 2026, 13:27 UTC. "Made $152.38K" is realized profit: only coins it has sold count here.
The report card for the same wallet, read at 13:18 UTC, added the other half. Over 7 days it ranked first by profit taken, $66,561, with a 92.9% win rate (26 coins won, 2 lost). But "all-in", with its unsold coins at that minute's prices, it stood at −$71,197. Over 30 days the gap was smaller but pointed the same way: $152,384 taken, −$15,531 all-in. The card also counted 83 coins traded in 7 days, 57 of them gone (nearly) to zero: 69%.
How can a wallet win 93% of its closed trades and still be deep in loss? Because a closed trade is one it sold. The losing coins were never sold, so they never became "losses" in the win rate. They sit in the open positions instead. At 13:27 UTC the wallet page's "What it's buying now" list showed its newest positions, bought 13–15 hours earlier, all still 100% held and all down between 97.1% and 99.3% since its buys.
Those tokens are named after famous companies or products. They are copycat meme coins, not affiliated with those names, and on Solana dozens of tokens with the same name can launch in a day. This wallet's swaps show it buying at least nine different tokens called "YouTube" between 22 and 28 October.
One trade, split into its realized and unrealized parts
One of those "YouTube" tokens shows the whole mechanism in a single trade (token page, contract MKzAMExSooHhfTBSeC7ToFxjJwPRa8gp4FCWTfApump). The tracker's 7-day data listed this as the wallet's "fastest flip": three times its money in 317 seconds. Here is what the swaps say:
| Time (UTC) | What happened | Amount | Share of the coins |
|---|
| 25 Oct 2026, 05:58:47 | One buy, at an implied market value of about $115K | $15,325.85 | 100% bought |
| 25 Oct, 06:04:04 | First sale, 5 min 17 s later, at 3.1× its buy price | $3,051.78 | 6.4% sold |
| 25 Oct, 06:04:48–06:27:36 | 14 more sales; the last one below its buy price | $3,239.67 | 17.6% sold |
| 28 Oct, 13:22 | Still held, marked at $0.000001884 | ≈ $189 value | 76.0% held |
Now apply the three formulas:
- Realized: it sold 24.0% of its coins for $6,291.45. Those coins cost 24.0% of $15,325.85, about $3,684. Realized profit: about +$2,607. The trade counts as a win.
- Unrealized: the remaining 76.0% cost about $11,642 and was worth about $189 at 13:22 UTC. Unrealized result: about −$11,453.
- All-in: about −$8,845 on a "3× flip".
So a wallet can show a high win rate, a top ranking and a "fastest flip", and its followers can still lose most of what they put in. The headline numbers were never wrong; they were simply about the part of each trade that went well.
The same arithmetic can also run the other way. Wallet 6451zSoUiy4GZeq2vEUHb73LcDJ8eeCHXEaGSqL8K6Fj had taken $29,084 in 7 days but stood at $32,392 all-in (report card, 13:18 UTC): its open coins were worth about $3,300 more than they cost. Its page at 13:28 UTC showed one of them, ANT, with $2.76K in, +451.8% since its buys, and 49% still held. That is an unrealized gain, and it is just as temporary as an unrealized loss.
How do you assess a wallet's track record? Six checks, applied to four wallets
A single profit figure hides how the profit was made. These six checks take a minute each on a wallet page, and together they separate a repeatable trader from a lucky one.
- Coins traded. Profit spread over 80 coins says more than profit from 8. Very few coins means very little evidence.
- Share of profit from one coin. If one coin made most of the profit, you are looking at one good call, not a method. On DexTrading the report card states it ("One coin (HOOKED) made 73% of its profit taken") and the copy page's table marks it ("66% from 1 coin").
- Hold time. This decides whether you can follow at all. Median hold is the honest number; an average is pulled up by a few long holds.
- Coins gone to zero. A high share means the wallet keeps buying tokens that die, which is where unrealized losses hide.
- Win rate, read with the other five. A 40% win rate with big winners can be healthy; a 93% win rate with dead coins left unsold, as in section 2, is not.
- An overall score. DexTrading's trader score (0–100, graded A–E) combines profitability, win rate, consistency and experience. Use it as a summary, then check the parts.
Here are the four wallets side by side. Figures are from the report cards read at 13:18 UTC (7 days) and the wallet pages read at 13:27–13:29 UTC (30 days and the score).
| Check | 6451zSoUiy4GZeq2vEUHb73LcDJ8eeCHXEaGSqL8K6Fj | 4BdKaxN8G6ka4GYtQQWk4G4dZRUTX2vQH9GcXdBREFUk | hnu69n6P5CgYXCtUKii9wgamqtDeTVHY3TVJ6HKt7wC | 13fKkRz2Fa4BV3kkgTSD9PKDMdsQaRjsZRjYTnApbYPM |
|---|
| Style | Day trader | Scalper | Scalper | Scalper |
| Coins traded, 7 days | 26 | 86 | 56 | 83 |
| Profit from its top coin | 73% (HOOKED) | 52% (Moustache) | 40% (OGDOGE) | 27% (BARRON) |
| Median hold | 19 min | 2 min | 40 s | 8 min |
| Coins gone to zero, 7 days | 0 of 26 | 0 of 86 | 0 of 56 | 57 of 83 |
| Win rate, 7 days | 44% (11 won / 14 lost) | 68.6% (59 / 27) | 94.6% (53 / 3) | 92.9% (26 / 2) |
| Profit taken, 7 days | $29,084 | $15,750 | $12,825 | $66,561 |
| All-in, 7 days | $32,392 | $15,467 | $12,825 | −$71,197 |
| Realized, 30 days | $32.19K on 46 tokens | $66.01K on 385 tokens | $46.95K on 278 tokens | $152.38K on 173 tokens |
| Trader score | 63, grade C | 84, grade A | 84, grade A | 74, grade B |
| Wallet age | 83 days | 879 days | 399 days | 78 days |
No wallet passes every check, and that is normal. What matters is knowing which weakness you are accepting.
6451zS...K6Fj: one coin carried the week
This day trader is profitable after its unsold coins, with no coin gone to zero in 7 days. But 73% of its 7-day profit came from one token, HOOKED, and it traded only 26 coins in that time. Its 30-day record (46 tokens, 55% win rate, score 63, grade C) is shorter and thinner than the others. It is a wallet to learn from rather than to copy blindly, and section 4 follows its HOOKED trade from first buy to last sale (wallet page).
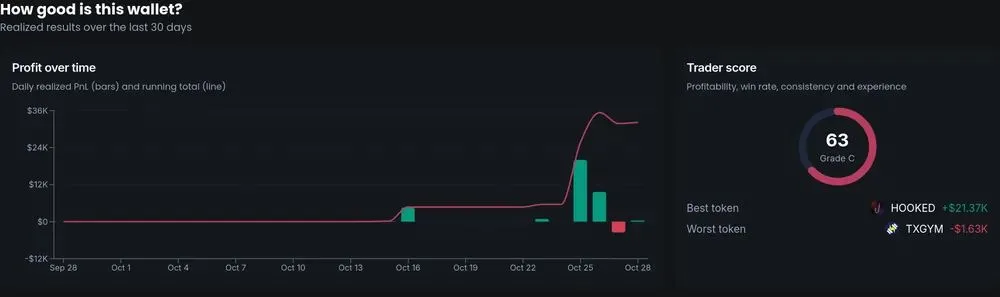
"How good is this wallet?" on wallet 6451zS...K6Fj, 28 Oct 2026, 13:28 UTC: score 63, grade C. Its top coin, HOOKED, made $21.37K of the $32.19K realized in 30 days.
4BdKax...EFUk: many coins, none dead, one standout
This scalper (wallet page) traded 86 coins in 7 days and 385 in 30, with none gone to zero in the 7-day count, a 63–69% win rate and a score of 84 (grade A). Its wallet is 879 days old, so the record covers more than one market phase. The caveat is concentration again: 52% of its 7-day profit came from Moustache (token page, J9WL4zQVCFvLTydjtHoMGcLasjhRMZomnVmp4Y2cpump). Its swaps show how: it first bought $88.88 at 20:32:34 UTC on 23 October, while the token was still on its launch curve at an implied value of about $4,400, took two small losses on quick round trips, bought again for $203.12 and $50.75 at 20:52–20:55 UTC, and then sold in 13 steps between 21:49 UTC that evening and 02:07 UTC the next morning, for a total of $8,795.30 against $569.42 put in. When it began selling, the price was about 14 times what it had paid on that re-buy an hour earlier, so a follower who saw the buy an hour late would have been buying at its selling price. MadeOnSol's guide to what happens when a token graduates from the bonding curve explains why prices move this fast in a token's first hours.
hnu69n...t7wC: clean record, very hard to copy
On paper this is the tidiest wallet of the four (wallet page): a 94.6% win rate over 7 days, no coins gone to zero, all-in equal to profit taken (it held nothing it had bought in the last 10 days at 13:29 UTC), and a score of 84 (grade A). The catch is its median hold: 40 seconds. Section 6 shows what that means for anyone who tries to follow it.
13fKkR...bYPM: the high win rate that hid the losses
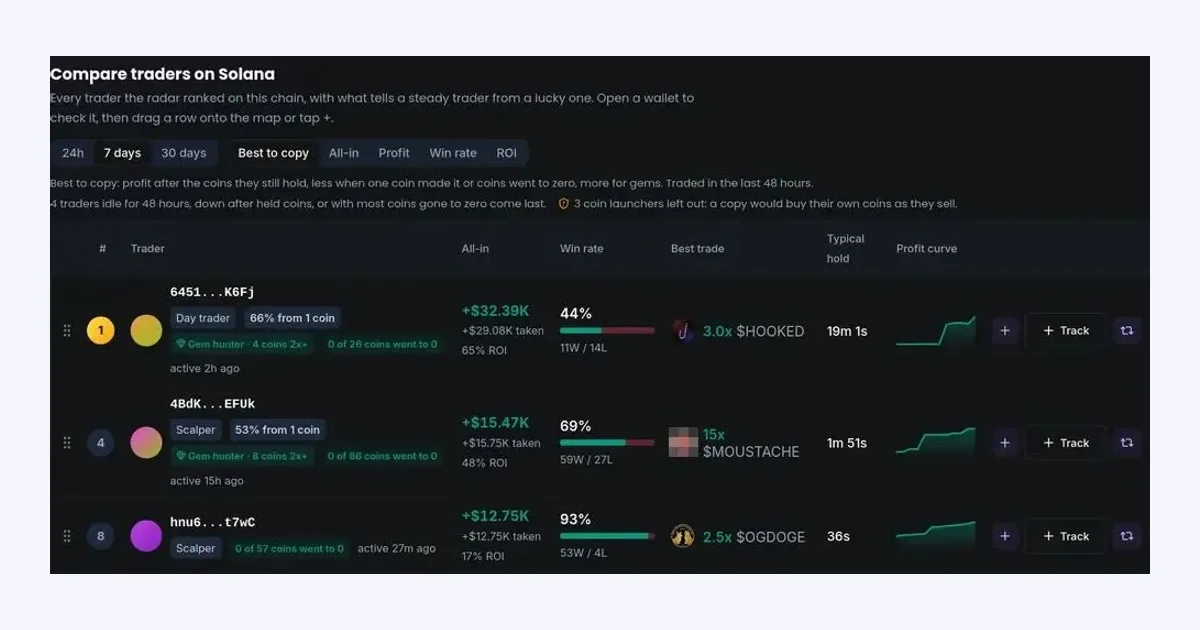
Covered in section 2: first by profit taken, a 92.9% win rate, and still about $71,000 down all-in after 57 of its 83 coins went to zero. The copy page's own ranking treats it accordingly: its trader table puts wallets that are "down after held coins" last, so the hottest wallet on the map was not among the ten traders shown first at 13:27 UTC.
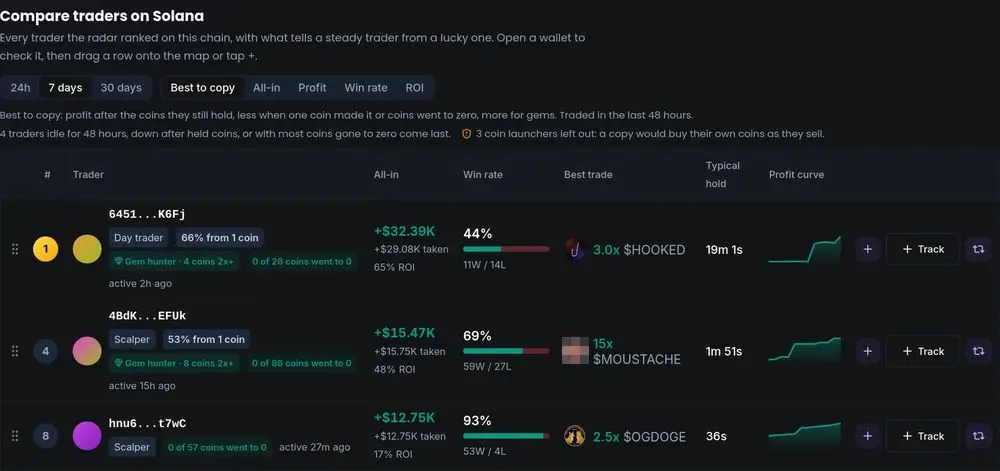
Three rows of "Compare traders on Solana" (7 days), 28 Oct 2026, 13:27 UTC, ranked by profit after the coins they still hold. Labels such as "66% from 1 coin" and "0 of 26 coins went to 0" are the track-record checks above. Rows of wallets used in other guides are left out of this image.
Small differences between pages are normal: the table above was read nine minutes after the report cards, so 6451zS's top-coin share reads 66% there and 73% on the card. When numbers disagree, note the time of each and use the later one.
Worked example: following one buy all the way to its sales
A tracker shows you a buy. To judge it, you need the rest of the trade: when the wallet added, when it sold, how much at each step, and what it holds now. Here is wallet 6451zS...K6Fj's trade in HOOKED (token page, contract C1mBfBoDkwWfd6uTFZp62ARHLjeVp3bDpCDMfMZtPngE), rebuilt from its 26 swaps of that token.
| Time (UTC) | Step | Dollars | Coins held after | Implied market value |
|---|
| 23 Oct 2026, 17:05:05–17:05:15 | Three buys in 10 seconds | $5,560.62 in | 10.77M | ≈ $453K–$493K |
| 23 Oct, 17:11:53–21:53:17 | 12 more buys as the price rose | $5,051.48 in | 17.67M | ≈ $516K–$873K |
| 24 Oct, 00:04:38 and 15:48:57 | Two tiny top-ups | $5.79 in | 17.68M (100%) | ≈ $655K–$735K |
| 25 Oct, 14:45:57–14:47:12 | First sales: 4 swaps in 75 seconds | $10,713.73 out | 12.80M (72.4%) | ≈ $2.0M |
| 25 Oct, 17:46:12–17:53:14 | Exit: 5 swaps in 7 minutes | $21,250.08 out | 0 (0%) | ≈ $1.38M–$1.63M |
Read it the way a follower would have lived it:
- The entry was a decision, not a nibble. More than half of the $10,617.91 went in within ten seconds. On a tracker, a wallet's first large buy is the signal; the later small buys are additions.
- The wallet kept buying as the price rose, from about $0.000495 to about $0.000954 per token, so its average cost ended at about $0.000601.
- It took profit in two waves. About 46 hours after its first buy, it sold 27.6% of its coins near $0.0022, about 3.6 times its average cost. Three hours later, with the price lower, it sold the remaining 72.4%.
- Result: $31,963.80 out against $10,617.91 in: about +$21,346 realized, close to the $21.37K the wallet page shows for HOOKED. Nothing left unrealized: it held 0% after 17:53:14 UTC on 25 October.
Now the part that matters for anyone arriving later. At 13:20 UTC on 28 October, HOOKED traded at $0.001227 with $95.7K in its main pool, a $1.11M market value and 12.2K holders. That price was about 2.0 times this wallet's average cost and about 32% below its average sale price. Someone who saw "smart wallet bought HOOKED" on a tracker and bought on 28 October would have been buying a coin that this wallet had already finished with, at twice its cost.
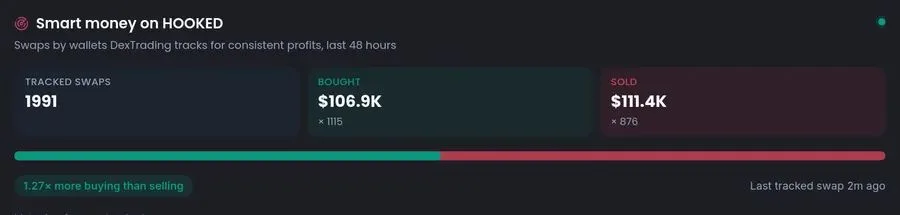
HOOKED's Smart money tab, 28 Oct 2026, 13:30 UTC, last 48 hours. The "1.27× more buying" counts swaps (1,115 vs 876); in dollars, tracked wallets sold more ($111.4K) than they bought ($106.9K).
The Smart money tab adds a useful lesson of its own: buyers outnumbered sellers by swaps, but sellers were larger by dollars. When a ratio is shown, check what it counts. MadeOnSol's guide to reading on-chain order flow on Solana goes deeper into reading large swaps against the crowd.
Before following any buy into a token, also check that its contract cannot be changed under you. HOOKED's Security tab at 13:29 UTC read "No red flags found: Mint authority revoked: supply is fixed; Freeze authority revoked; Top 10 wallets hold 19.9% of supply", and the chain itself agreed at 13:25 UTC (mint and freeze authority both empty). It also noted that the name and logo can still be changed.
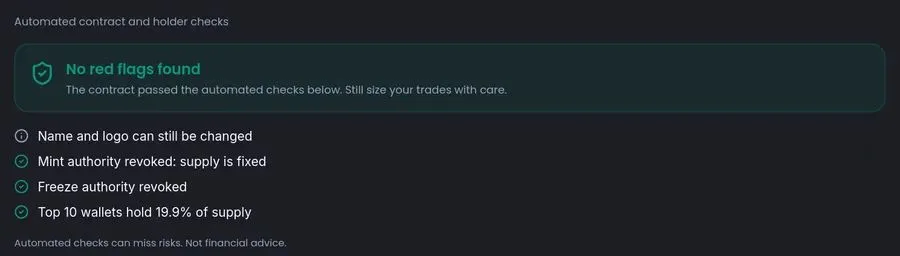
HOOKED's Security tab, 28 Oct 2026, 13:29 UTC. The mint and freeze results match what the Solana chain returned at 13:25 UTC.