If your trading bot depends on MadeOnSol's KOL feed or DEX firehose, you want an independent signal when the platform goes degraded — not a guess based on suddenly quieter alert volume. The standard way to wire that up is an external monitor (UptimeRobot, StatusCake, Better Uptime, Pingdom) that pings a known endpoint and pages you on failure.
GET /api/v1/status is built for exactly that. It is public (no auth), returns structured JSON, includes per-service status flags, and exposes 24-hour and 7-day observed uptime percentages. Updated September 2026: the endpoint now covers seven core services, treats stale/missing monitor rows as degraded, and also publishes data-quality SLO and verification-suite evidence.
The endpoint and response shape
curl https://madeonsol.com/api/v1/status
{
  "status": "operational",
  "services": {
    "kol_tracker": {
      "status": "healthy",
      "last_check": "2026-05-14T11:42:03Z",
      "response_ms": 84,
      "last_trade_age_s": 7
    },
    "deployer_listener": {
      "status": "healthy",
      "last_check": "2026-05-14T11:42:03Z",
      "response_ms": 41
    },
    "nextjs_app": {
      "status": "healthy",
      "last_check": "2026-05-14T11:42:04Z",
      "response_ms": 112
    },
    "supabase_db": {
      "status": "healthy",
      "last_check": "2026-05-14T11:42:03Z",
      "response_ms": 8
    },
    "websocket": {
      "status": "healthy",
      "last_check": "2026-09-29T20:40:04Z",
      "connections": 142
    },
    "rhc_node_sync": {
      "status": "healthy",
      "last_check": "2026-09-29T20:40:03Z"
    },
    "rhc_trades_freshness": {
      "status": "healthy",
      "last_check": "2026-09-29T20:40:03Z"
    }
  },
  "uptime": {
    "last_24h": 99.9,
    "last_7d": 99.7
  },
  "data_quality": {
    "slo_target_pct": 99.5,
    "window": "24h",
    "secondary_window": "7d",
    "accuracy": { "pct": 100, "samples": 96, "week": { "pct": 99.8, "samples": 672 } },
    "correctness": { "pct": 100, "samples": 96, "week": { "pct": 99.9, "samples": 672 } }
  },
  "verification": {
    "fast": { "cases": 42, "failing": 0, "cadence": "every 15 min", "last_run": "2026-09-29T20:30:00Z" },
    "full": { "cases": 180, "failing": 0, "cadence": "twice daily", "last_run": "2026-09-29T18:00:00Z" },
    "nightly": { "cases": 260, "failing": 0, "cadence": "nightly", "last_run": "2026-09-29T02:00:00Z" }
  },
  "checked_at": "2026-09-29T20:40:08Z"
}
Seven core services are covered:
kol_tracker — the gRPC subscriber that ingests KOL wallet swaps and writes kol_trades. The last_trade_age_s field reports seconds since the most recent insert. A healthy value is single-digit to low-double-digit; sustained >60s means the stream is broken.deployer_listener — the gRPC subscriber that watches tracked deployer wallets and emits alerts. Restarts are expected (gRPC reconnects) — the status flag captures actual liveness.nextjs_app — the API surface itself. If this is degraded, the status endpoint may not respond at all, so a separate uptime monitor is still useful even with this field.supabase_db — Postgres health. Slow responses here cascade to every endpoint.websocket — the WS streaming server. connections reports active subscriber connections.rhc_node_sync — whether the Robinhood Chain node/indexing source is keeping up.rhc_trades_freshness — freshness of the Robinhood Chain trade ingestion path.
Each service's status is one of:
healthy — operating normally.degraded — operating but with elevated latency or partial functionality. Worth investigating but not page-worthy.down — not operating. Page immediately.stale — the last health row is older than three expected 5-minute monitor cycles; the old reported state is no longer trusted.unknown — no check is available. It degrades the top-level status rather than disappearing from the calculation.
The top-level status is computed across all seven expected core services:
operational — all services healthy.degraded — at least one service is non-healthy (degraded, stale, unknown, or another error state), with none explicitly down.incident — at least one core service is explicitly down.
Uptime numbers
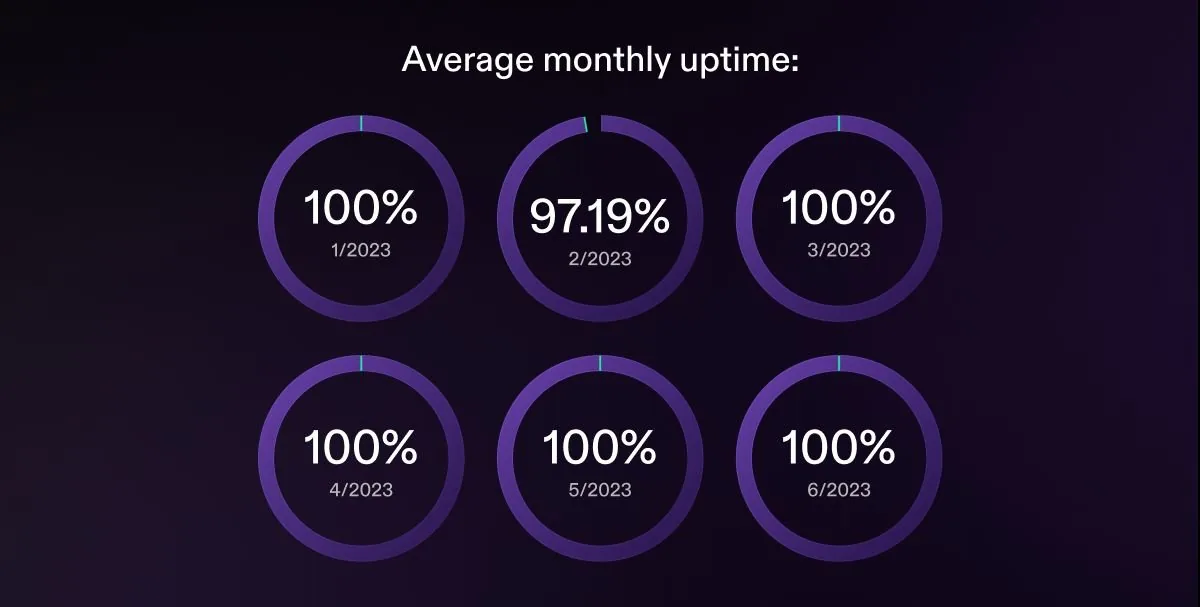
uptime.last_24h and uptime.last_7d are computed as the percentage of stored core-service health checks whose status was healthy in the rolling window. The health monitor writes the seven core rows on a 5-minute cadence, so a full 24-hour window is roughly 2,016 service-check samples. The percentage is rounded to one decimal place.
Treat this as an observed check-success ratio, not a minute-perfect SLA calculation: each sample represents a scheduled health observation, and a degraded row counts as non-healthy. The 24-hour value is the recent signal; the 7-day value gives longer context.
Caching and rate limits
- Server-side cache: 30 seconds. Multiple monitors hitting the endpoint in rapid succession see the same response.
- CDN cache header:
Cache-Control: public, max-age=30, s-maxage=60, stale-while-revalidate=300 — friendly to status pages embedding the endpoint.
- Per-IP rate limit: 30 requests per 60 seconds. More than enough for a monitor on a 60-second interval, with headroom for ad-hoc polling.
If you have multiple monitors hitting the endpoint, they share the per-IP bucket. For most setups (one monitor checking every 60s), you're nowhere near the limit.
Monitoring patterns
Three patterns cover most use cases, in increasing sophistication:
1. Simple alive check
The cheapest setup: monitor that GET /api/v1/status returns HTTP 200 within 5 seconds. UptimeRobot, StatusCake, Better Uptime all support this out of the box.
Failure case: the endpoint itself doesn't respond. That's a strong signal — the entire API is down or the network is partitioned. Page immediately.
Limitation: this doesn't catch service degradation. The endpoint will return 200 with status: "degraded" even when half the services are sick.
2. JSON body check
A small step up: pull the JSON and assert that status === "operational" (or whichever threshold you want). UptimeRobot's "Keyword" monitoring checks for a substring in the response body — set it to look for "status":"operational" and fail when missing.
# StatusCake / Better Uptime support response-body checks too
# Set the expected pattern: "status":"operational"
# Alert when the pattern is missing
This catches the case where the endpoint responds with "status":"degraded" or "status":"incident". You'll still get false-positives during brief degraded windows that auto-resolve; pair with an alert delay (e.g., "page after 2 consecutive failures") to filter noise.
3. Per-service fan-out
The richest setup: monitor each service field independently. Most external monitors support JSON-path extraction; configure separate checks for:
services.kol_tracker.status === "healthy"services.deployer_listener.status === "healthy"services.websocket.status === "healthy"services.supabase_db.status === "healthy"uptime.last_24h >= 99 (catches sustained-but-not-current degradation)
This way you get distinct alerts such as "KOL tracker unhealthy" or "RHC trade ingestion stale" and can route them by component. Remember that core health rows are produced on a 5-minute cadence; the endpoint's 30-second cache cannot make the underlying checks more frequent.
For the kol_tracker service specifically, also check last_trade_age_s if your monitor supports numerical comparisons. A value above 60 means the stream has stalled even if the service status hasn't flipped yet.
Building your own status indicator
The endpoint is a clean data source for embedding a status indicator into your own dashboard:
async function fetchMadeOnSolStatus() {
  const res = await fetch("https://madeonsol.com/api/v1/status");
  const data = await res.json();
  return {
    overall: data.status,
    kol: data.services.kol_tracker.status,
    ws:  data.services.websocket.status,
    db:  data.services.supabase_db.status,
    uptime_24h: data.uptime.last_24h,
    last_trade_age_s: data.services.kol_tracker.last_trade_age_s ?? null,
  };
}